

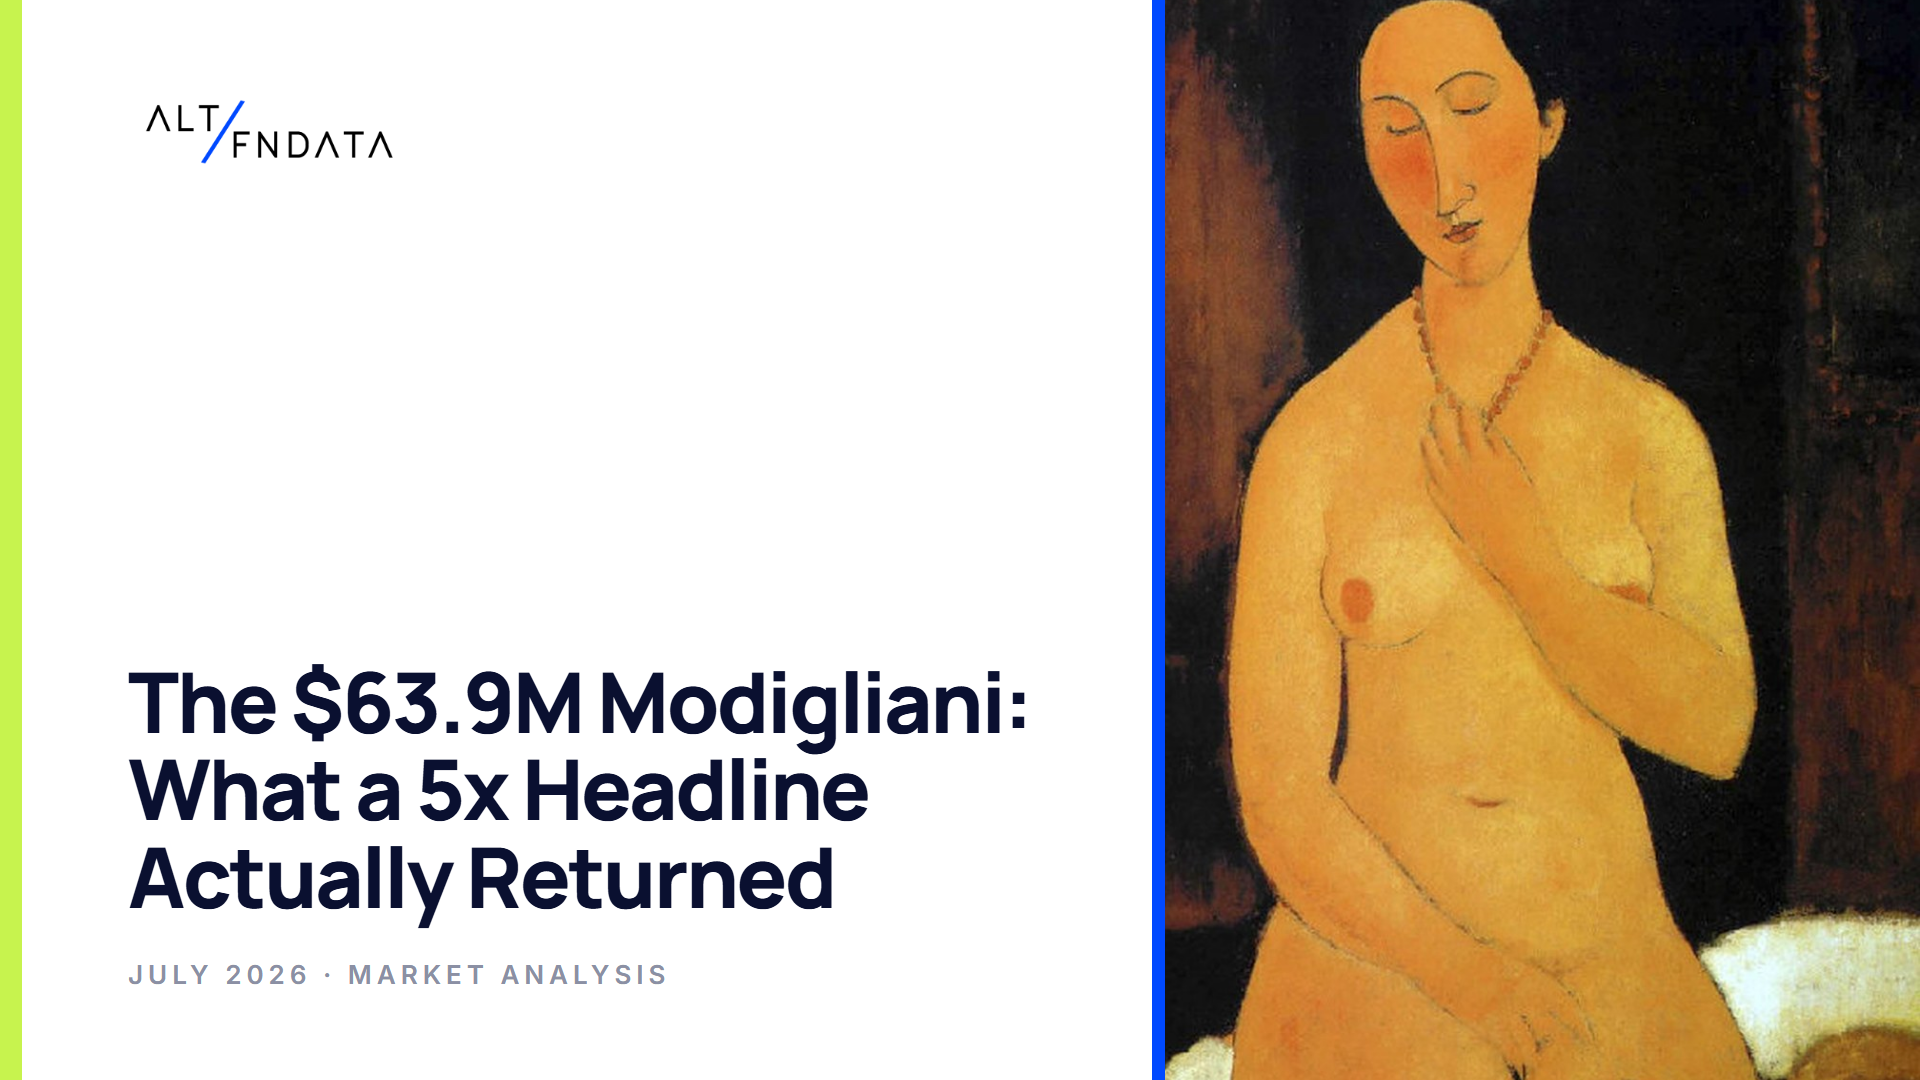
The sale
When the collection of the late British billionaire Joe Lewis sold at Sotheby's in late June for $392.6 million, the lot that carried the evening was an Amedeo Modigliani he had bought in 1995 for $12.4 million and which sold for $63.9 million. The press wrote it as a five-times triumph, and by the arithmetic of headlines it was. The more useful reading starts where the applause ends.
The honest math
$12.4 million to $63.9 million over roughly thirty-one years is a 5.15x multiple, which compounds to 5.4 percent a year. Adjust for inflation, since a 1995 dollar bought about twice what a 2026 dollar does, and the real return falls to roughly 3 percent a year. Then come the frictions the headline never carries: the $63.9 million includes the buyer's premium, while the consignor is paid on the hammer, so several million of that figure never reached the seller; and three decades of insuring, storing and conserving a masterpiece is a real annual cost. The investor's return, as opposed to the auction room's, sits meaningfully below 5.4 percent.
| Framing | The Modigliani | The S&P 500 |
|---|---|---|
| Headline multiple | 5.15x | 13.7x price only |
| Annualized return | 5.4% a year | 8.8% a year price only, near 11% with dividends |
| $12.4M in 1995 becomes | $63.9M | roughly $170M price only, near $290M with dividends |
| After inflation | roughly 3% a year | roughly 6.5% a year price only |
The benchmark nobody runs at the rostrum
On the June 1995 close the S&P 500 stood at 544.75; on July 2, 2026 it closed at 7,483.24. That is 13.7x price only, about 8.8 percent a year, and near 11 percent with dividends reinvested. The same $12.4 million left in the index would be roughly $170 million on price alone, and near $290 million with dividends. Against the picture's $63.9 million, the trophy trailed the index by well over $100 million, and that is the point the saleroom applause obscures: a great result and a great return are not the same thing.
The two Modigliani markets
Our database holds 566 Modigliani lots, 181 of them with realized prices, and they describe two markets wearing one name. At the top sit nineteen results above $1 million, led in our records by $70.7 million in 2014 and $69.0 million in 2010, with the publicly documented records higher still: $170.4 million in 2015 and $157.2 million in 2018. Read that sequence again and notice what it says: the ceiling of the Modigliani market was set roughly a decade ago. The $63.9 million result, strong as it is, lands beneath peaks reached in 2014 and 2015.
Meanwhile the median priced Modigliani lot in our data is $35,131, because most of what trades under the name is works on paper and prints. The name is blue chip; the market beneath it is two very different assets, and a collector quoting the record and a collector buying a drawing are not operating in the same market at all.
What this means
For wealth managers and family offices, the Lewis Modigliani is the cleanest case study in years: a genuinely great picture, held for a generation, sold at the right house in a strong season, and it still compounded at less than half the public market. Art earned its place in that portfolio as art, as provenance, and as the kind of asset that made the rest of the collection more valuable by association. It did not earn it as an index substitute.
The buyers who understand that distinction are the ones our data serves. The question realized prices answer is not whether a picture will beat the S&P; it is what the thing actually trades for, what it has done over time, and which of a name's several markets you are standing in when you raise your hand.
What to take away
One sale, three disciplines worth keeping:
Quote returns, not multiples
A 5x over three decades is mid single digits a year. Any long-hold auction headline should be read through its annualized rate, and then through inflation, before it is read as investment performance.
Mind the frictions
The buyer's price includes the premium; the seller is paid on the hammer. Between commissions, insurance, storage and conservation, the investor's return on a trophy sits below the saleroom's headline, every time.
The name is not the market
Nineteen Modigliani results above $1 million sit atop a market whose median lot is $35k. Blue-chip names contain several markets at once, and knowing which one you are buying is the whole game.
The Lewis Modigliani was a great picture, a great consignment and a great headline, and it still compounded at 5.4 percent a year against an index that did nearly twice that. None of that is an argument against owning art; it is an argument for knowing what the asset is. Buy the object for what only the object gives, provenance, beauty and standing; measure it the way you measure everything else; and read the saleroom for what it actually is, the one market that tells you what the thing is worth in money rather than in applause.
“A great result and a great return are not the same thing. The saleroom applauds the multiple; the portfolio lives on the annualized rate.”
Methodology & about
Methodology
This is a market read. Sale figures for the June 2026 Sotheby's sale, including the $12.4 million purchase (1995), the $63.9 million result and the $392.6 million collection total, are per public reporting; the sale is recent enough that it is not yet reflected in our own capture. Returns are computed on those public figures over an assumed 31-year hold. The S&P 500 comparison is price-only from the June 30, 1995 close (544.75) to the July 2, 2026 close (7,483.24); dividend-reinvested estimates assume roughly two percentage points a year of dividend yield. Inflation adjustment uses the approximate doubling of US consumer prices between 1995 and 2026. Modigliani corpus figures are from ALT/FNDATA's record of 13M+ auction results across 100+ houses worldwide: 566 lots identified by artist or title, 181 with realized prices, converted to USD at nearest-date exchange rates. The publicly documented Modigliani records of $170.4 million (2015) and $157.2 million (2018) predate that corpus's top entries and are cited from public reporting. Sellers' net proceeds vary with negotiated terms.
ALT/FNDATA is a market-data platform tracking 13M+ auction results across 100+ houses worldwide: the neutral, cross-market record of what luxury and alternative assets actually sell for at the hammer, not asking prices.
Cite this report
Source: ALT/FNDATA, “Why the $63.9M Modigliani Returned Less Than an Index Fund” (July 2026). Based on public purchase and sale figures for the June 2026 Sotheby's sale, read against ALT/FNDATA's record of 566 Modigliani lots (181 with realized prices) and the S&P 500 over the same holding period. © 2026 ALT/FNDATA · altfndata.com/reports/the-modigliani-return-2026