










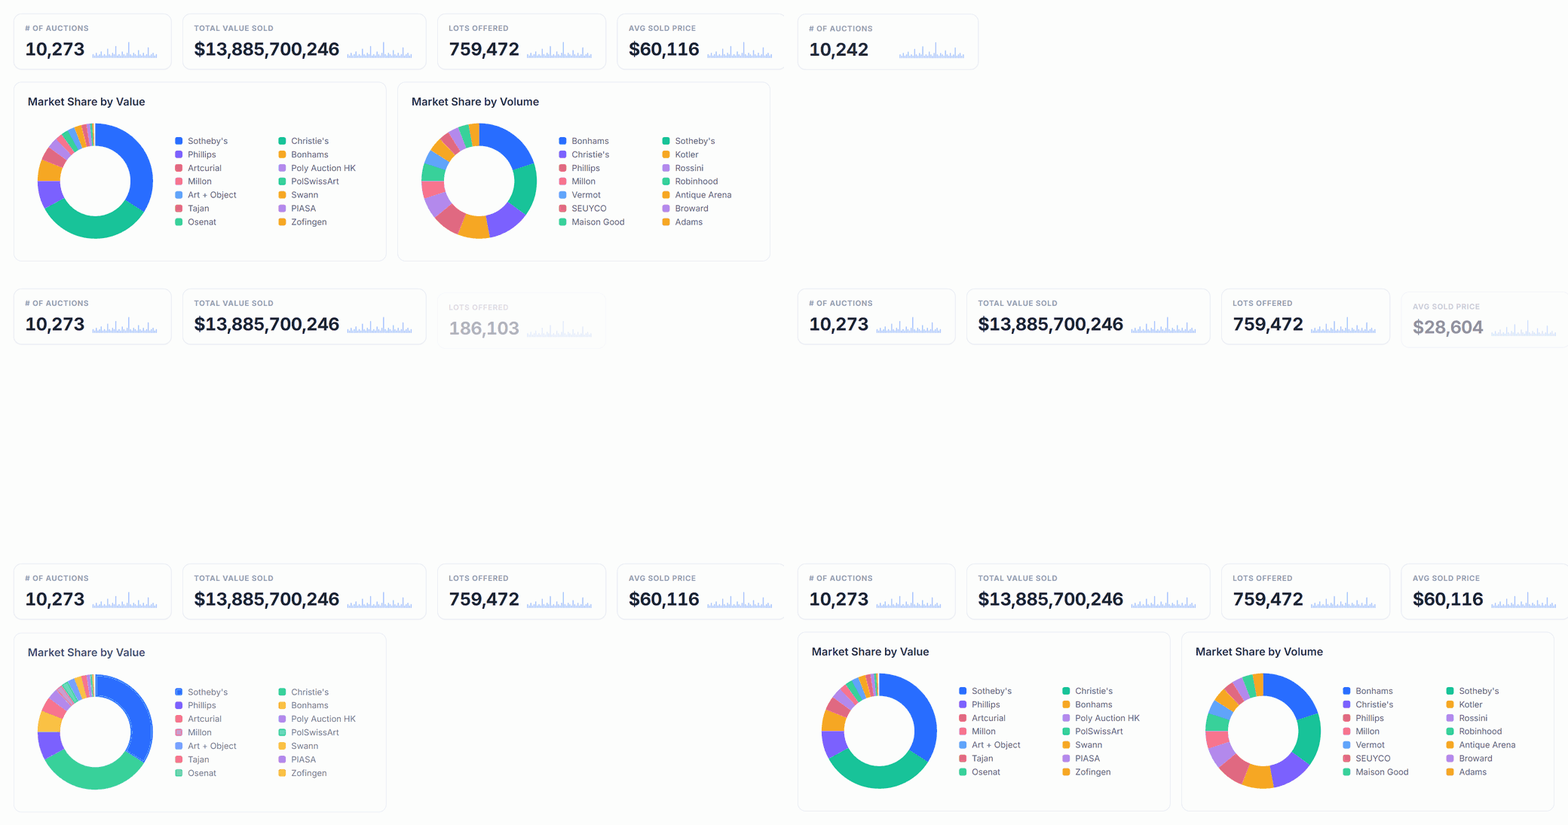
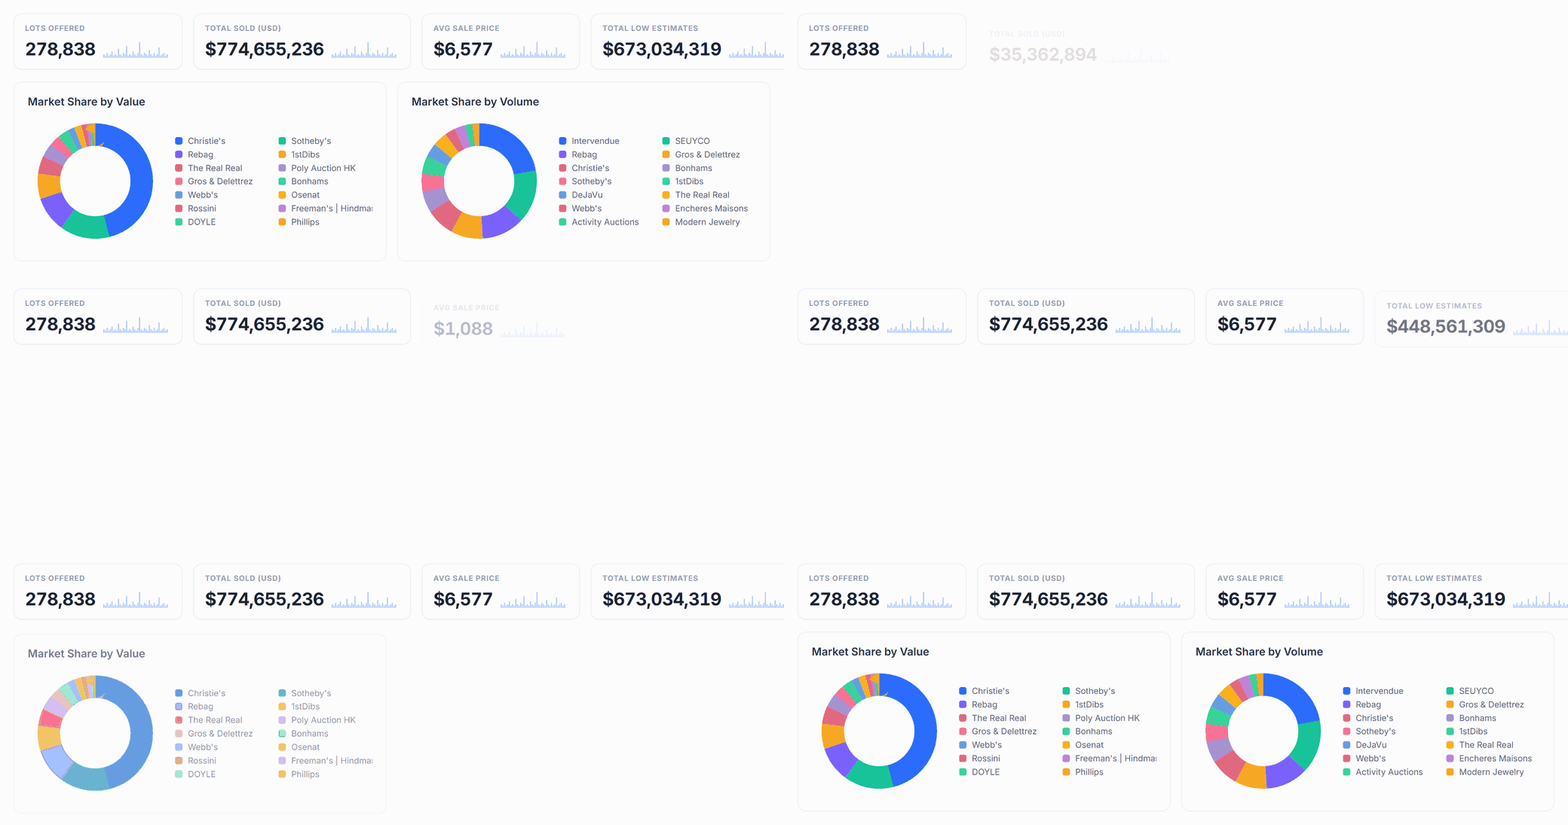
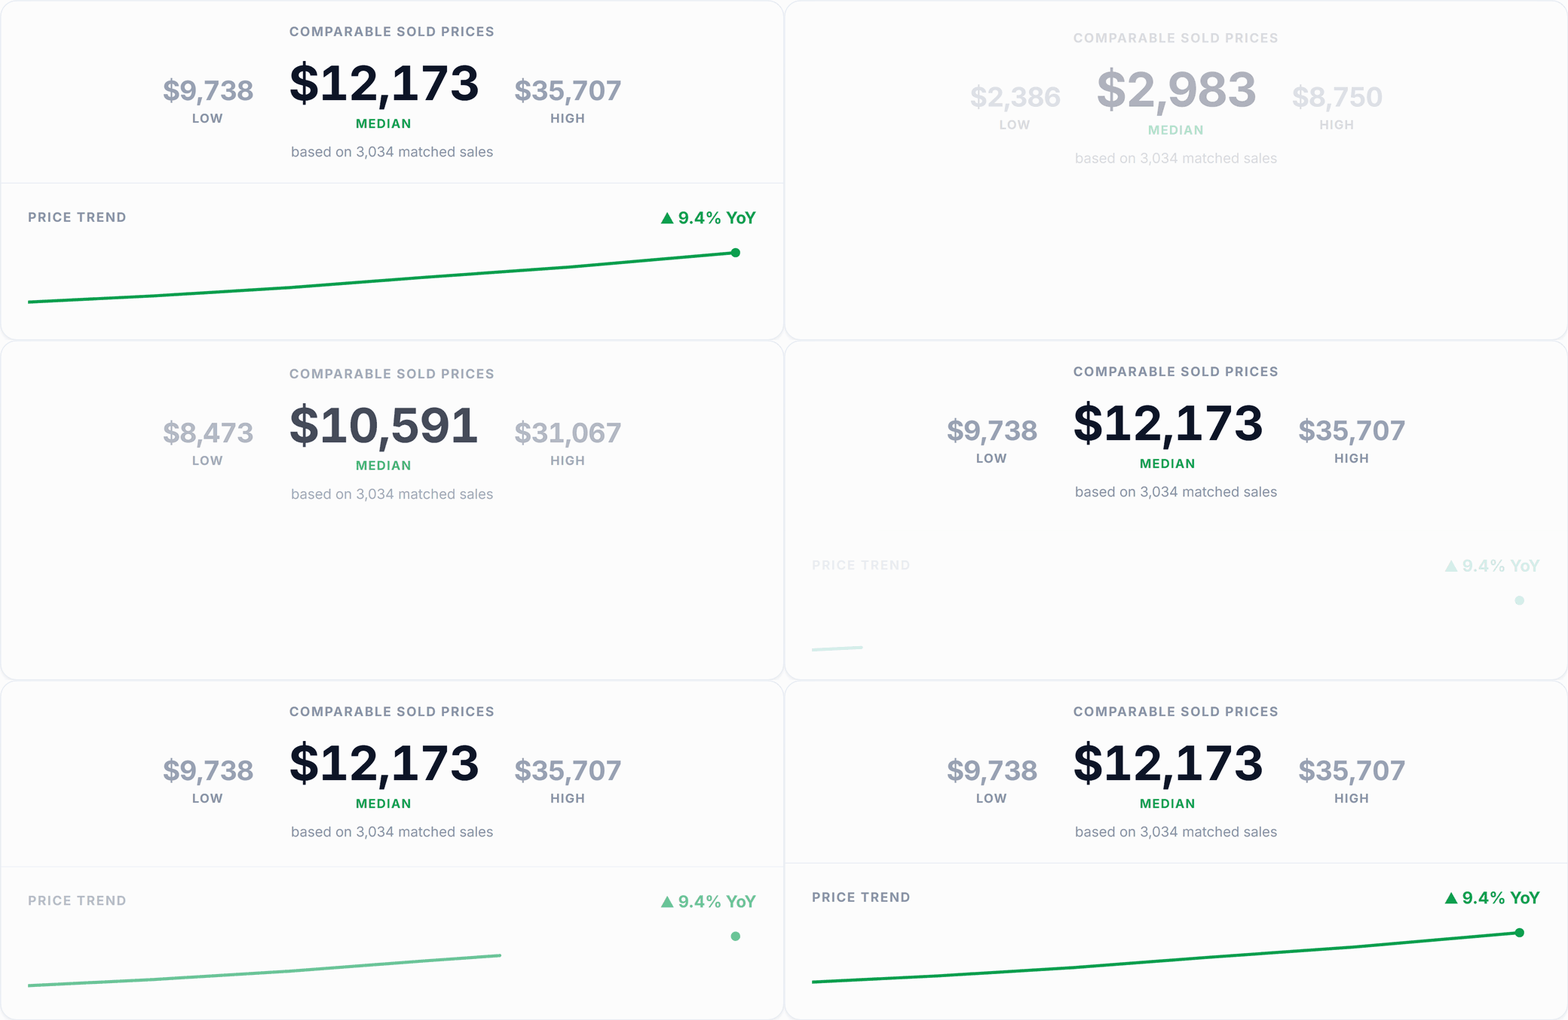
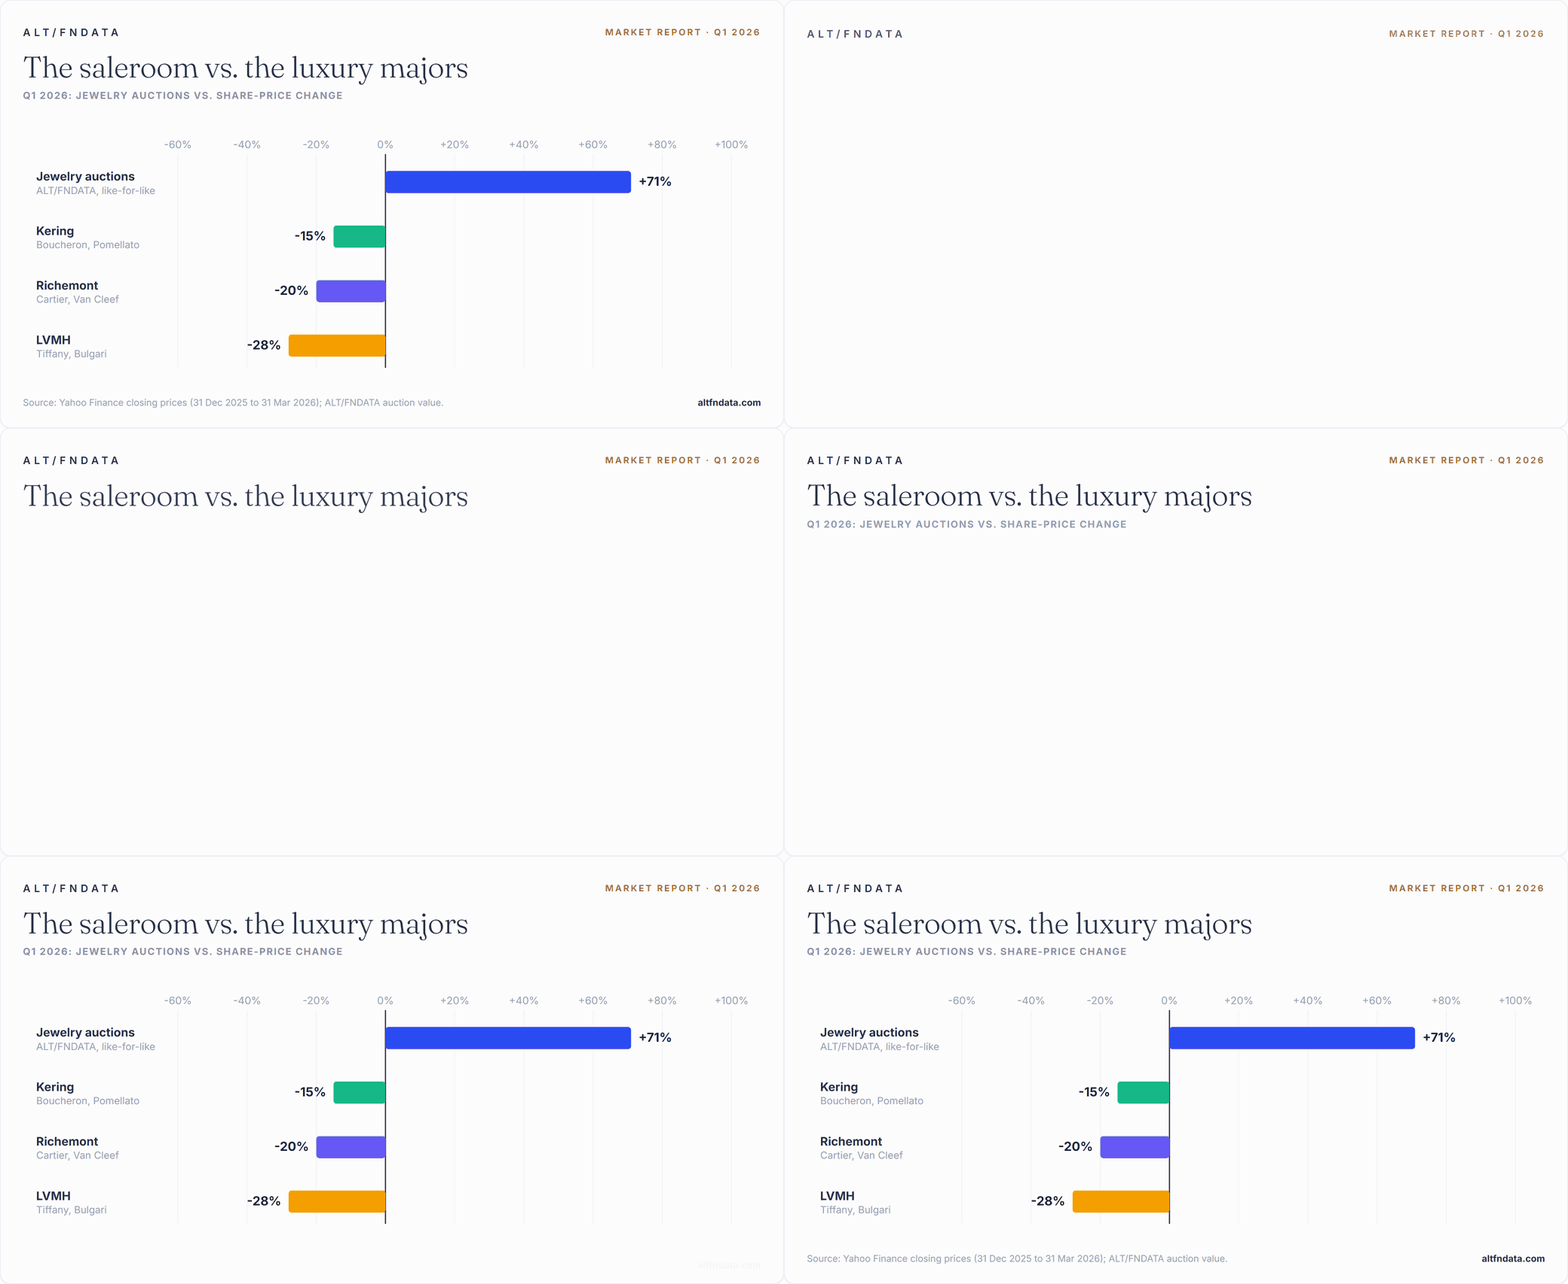
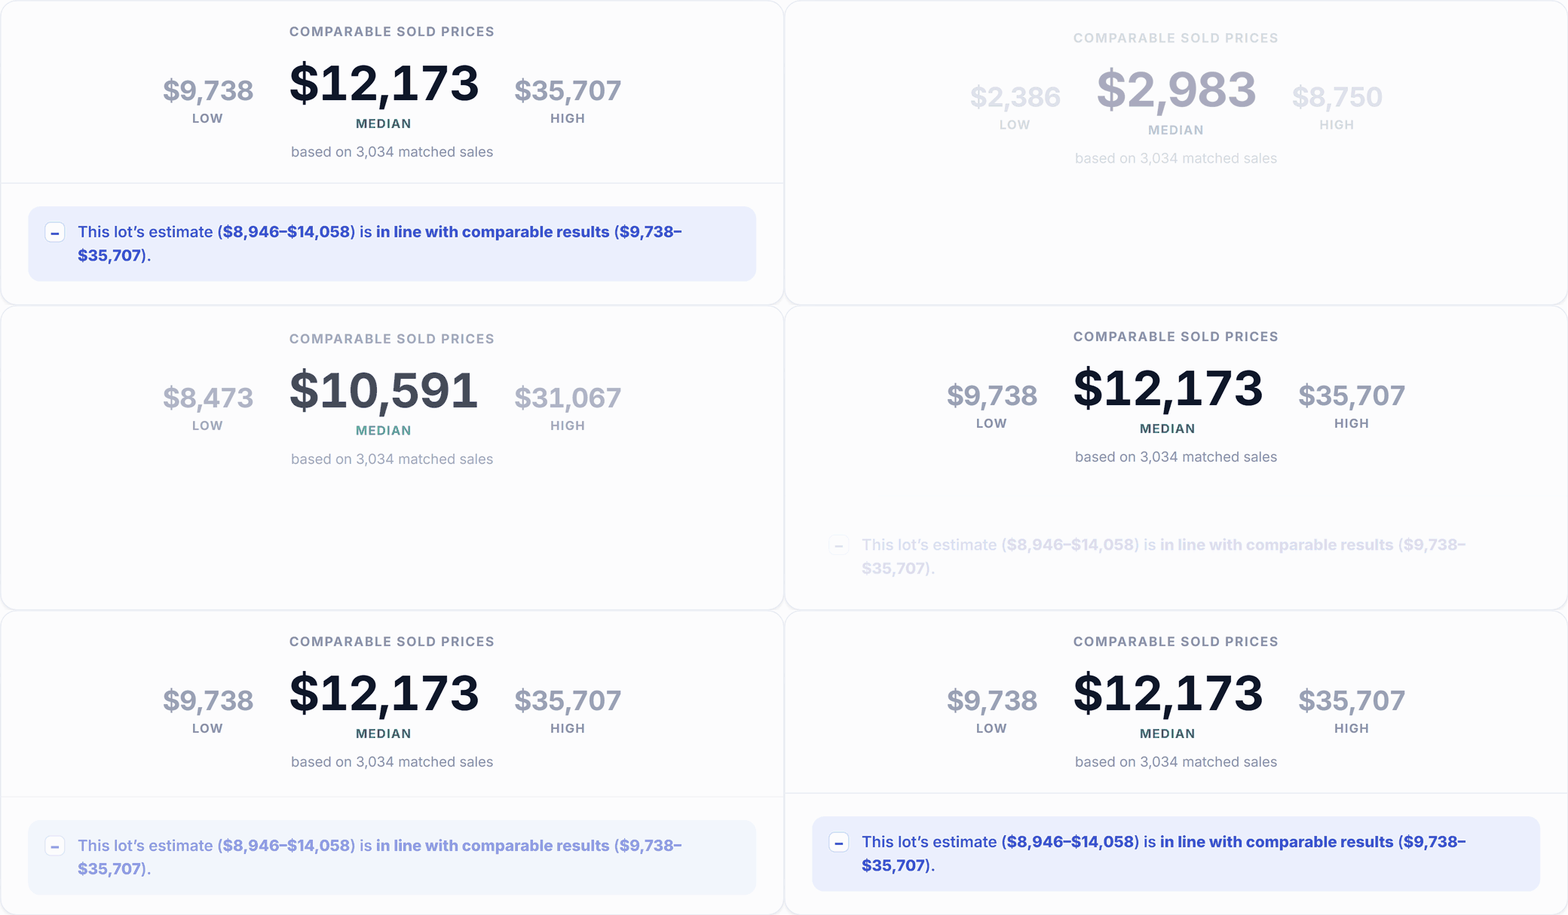
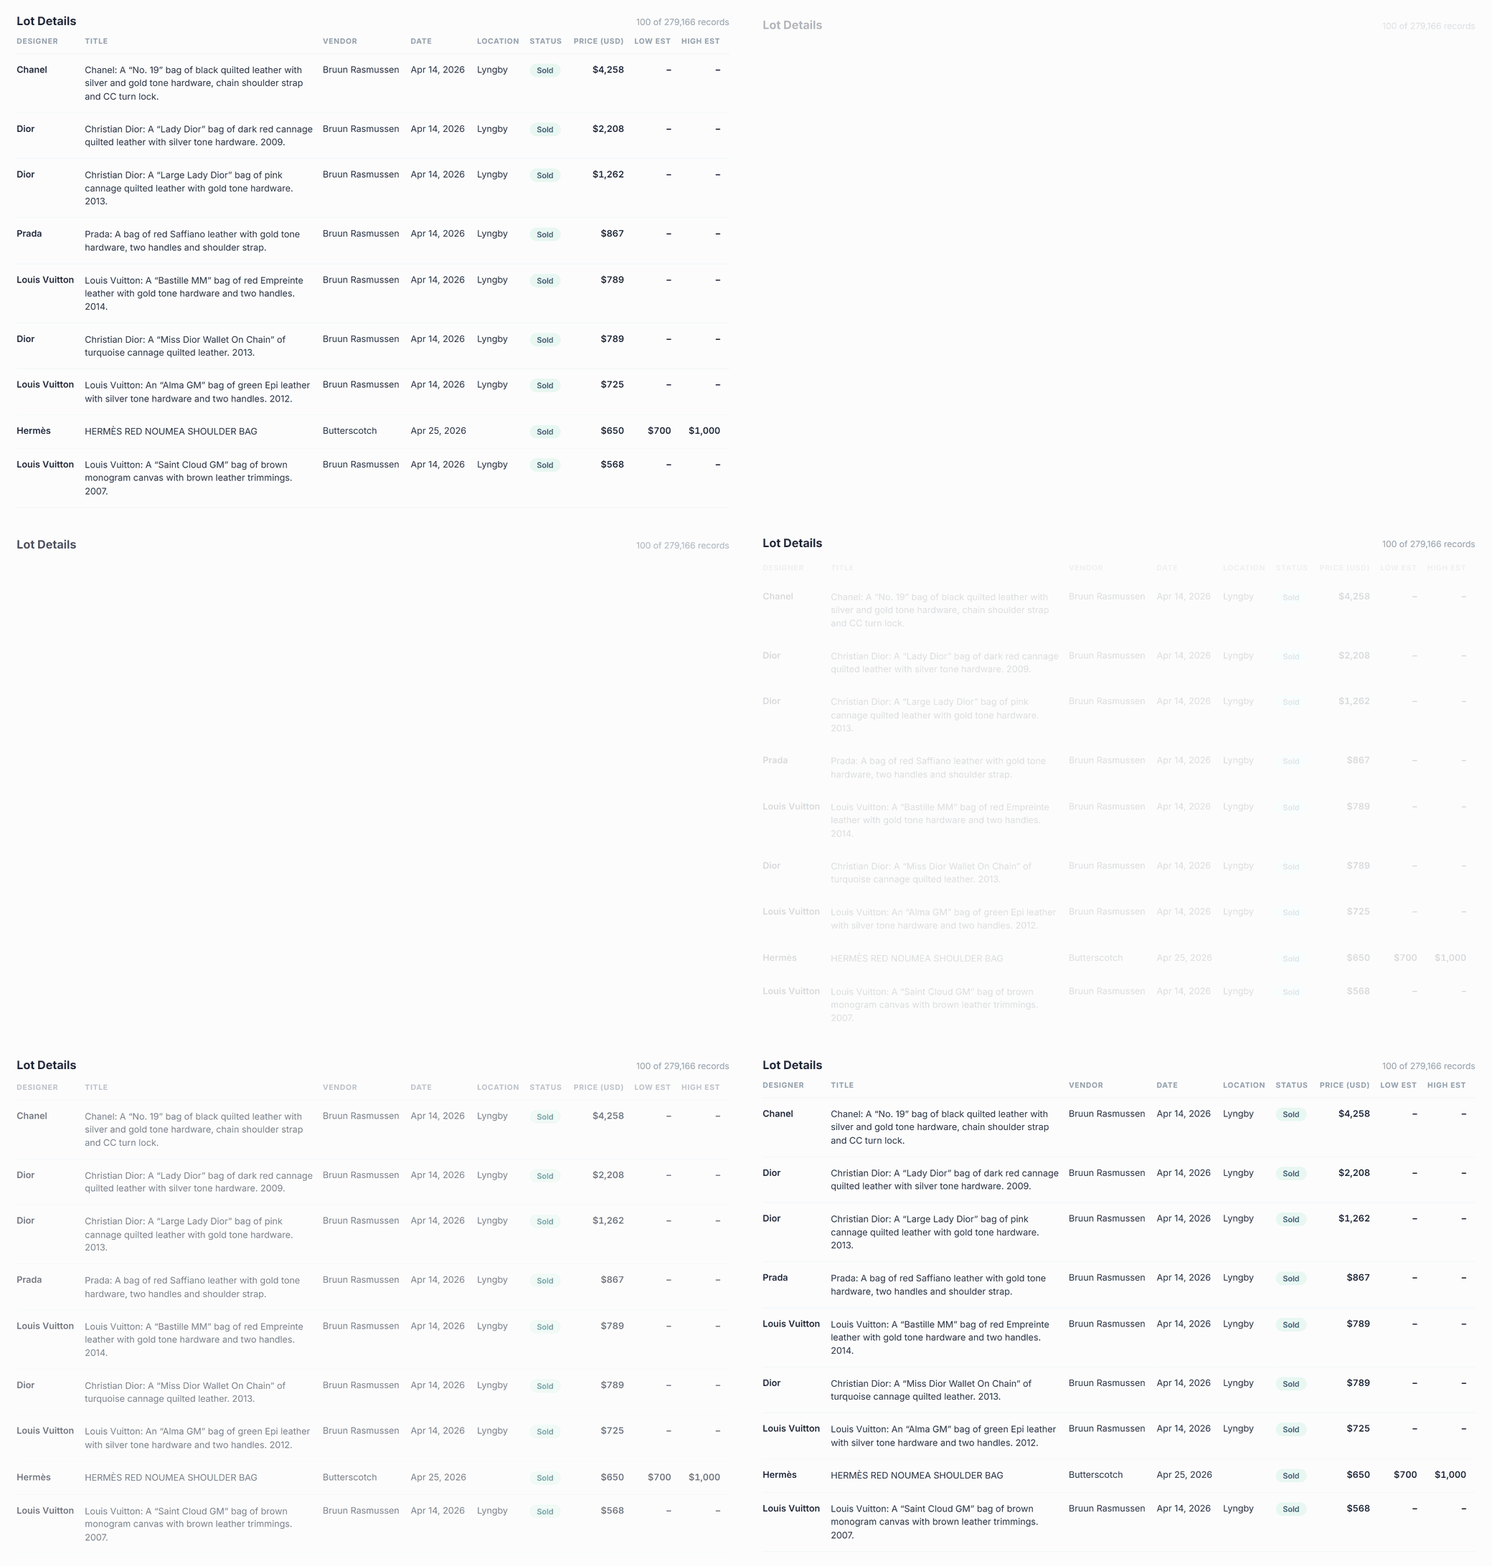
And it is interactive. Filter by house, category, date, and price band · drill into any lot · compare categories side by side · export to CSV or pull the same data via the API.
Every one is pre-built from verified sold results across 8 asset classes. Sign in and read the market. There is nothing to configure first.
Track a single maker's realized prices over time.
Rolex · Patek Philippe · Audemars Piguet · Omega · Cartier · Vacheron Constantin · Hermès · Chanel · Louis Vuitton · Tiffany · Bvlgari · Van Cleef & Arpels · Champagne · Whisky · Cognac · Harley-Davidson · Ducati · Triumph · Honda
Read a school or period as its own market.
Impressionism · Surrealism · Baroque · Dutch & Flemish Baroque · Northern Renaissance · Romanticism · Rococo · Modern · Contemporary · Photography
Value, volume, and market share for a whole asset class.
Fine art · Watches · Jewelry · Gems · Handbags · Automobiles · Motorcycles · Wine & whisky
The headline read for each asset class, already interpreted.
One per category, plus a cross-market overview
Narrower cuts for when the category view is too broad.
1950s cars · 1960s cars · Supercars · Global gemstones · Fine art by item type · Automobiles by item type
Put two things side by side and settle it.
Year over year · By auction · Brand vs brand · Item vs item
The dashboards are only as good as what sits behind them, so here is what that is.
Every figure is a realized result from a completed auction. Estimates never enter the numbers.
Prices are normalized to USD at the exchange rate nearest each sale date, so a Geneva result and a New York result compare like for like.
From the marquee rooms to the regional specialists, deduplicated to a single record per lot.
A lot that actually closed at auction with a published result. Estimates and asking prices are never treated as outcomes, and unsold lots are tracked separately so they cannot flatter a price trend.
No. All 56 dashboards are pre-built and ready the moment you sign in. There is no query to write, no spreadsheet to load, and no data engineering to do first.
Yes. Every view exports to CSV, and the same figures are available through the Data API and the Claude connector if you would rather pull them into your own tools.
Price Check answers one question about one object: what is this worth. The dashboards are for reading an entire brand, category, or market over time.